Projects
An incomplete list of things I've worked on recently, hosted either here at blm.io, on my Wordpress blog or on my new Huffington Post blog (sometimes all three).

Mandelbrot set explorer in Shiny
An R package (mandelbrot)
and Shiny application (shinybrot)
for exploring the Mandelbrot set, both written in R —
•

Blackspot
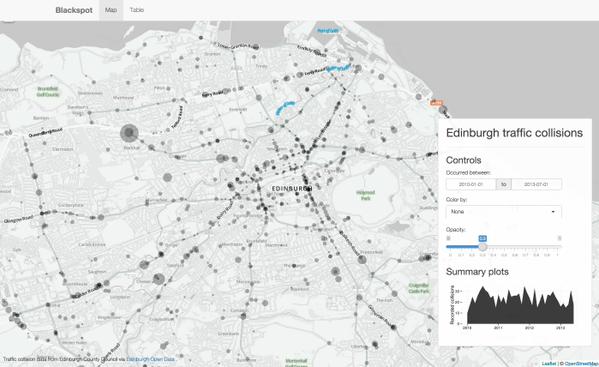
A web application developed in Shiny exploring reported road traffic incidents in Edinburgh, dating from 2011. This work in progress app maps collisions, highlighting blackspots in the city. — blackspot.org.uk •
Interactive charts in R
I gave a talk at May's EdinbR meeting on "Interactive charts in R". In it I show some examples of interactive javascript plots generated in R, and also discuss the growing trend of gluing together R and web libraries using htmlwidgets. — blm.io/talks/edinbr_may/ •

#SummerDataChallenge competition entry
Imperial's #SummerDataChallenge challenged entrants to not only do some interesting analysis and data viz on their prepared datasets, but also use the results to put forward plans for a business or product. In my entry, I analysed London house price datasets and planned to make the results openly available to aid property investment decisions. I came 3rd, winning £2,000! — blm.io/datarea •
Hollywood action heroes
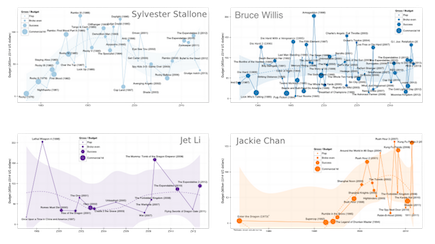
Arnie, Stallone, Bruce Willis — they've been starring in great action films for years, but how are their box office receipts? I take a look at the hits and flops of a selection of A-list action stars over their careers, as well as investigating who's the best value-for-money as a leading man. — blm.io/action
Celebrity twitter followers split by gender
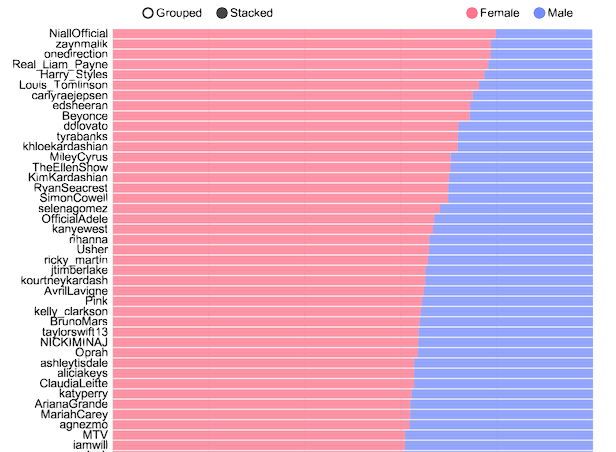
What's the gender split of followers for the most popular twitter accounts?
Here I use first names to probablistically assign genders and get an
overall picture of which accounts are skewed towards female followers, and
which are preferred by males. There's a short summary on my
Huffington Post blog. —
 •
blm.io/twitter
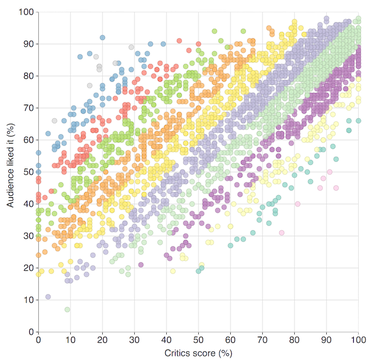
Underrated and overrated movies
Where do reviewer and critic ratings diverge most? By comparing
the two ratings we gain some insight into films that are "overrated"
by critics, relative to how they went down with audiences. Mentioned in:
io9,
BusinessInsider,
FiveThirtyEight,
the A.V. club,
r/DataIsBeautiful,
FlowingData,
Buzzfeed and a couple of others.
—
 •
blm.io/movies
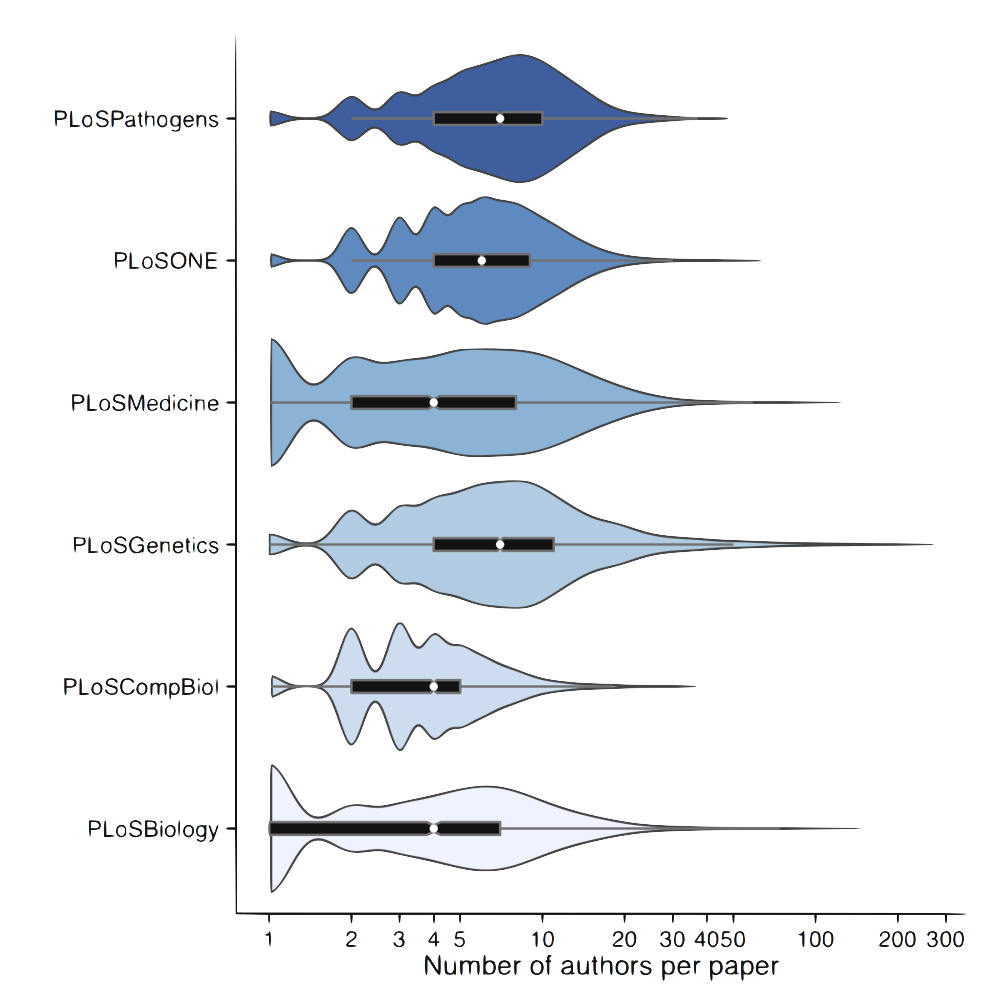
Evidence for author inflation in modern academia
Author lists for academic articles in a variety of scientific fields
appear to be growing. Here I quantify this phenemon, finding
author inflation to be happening at rates of up to half an extra author per year,
on average. I investigate this trend over the past decade at six open access life science journals.
—

UK political polling and election history
Using monthly polling data and general election results dating back to 1984, I chart the changes in
popularity of the three main political parties in UK politics. Non-linear models reveal
trajectory dynamics in the run-ups to the six UK general elections covered by the dataset. —
