Scottish independence: what do the polls say?
Living in Edinburgh it's been hard to avoid the build-up to Scotland's referendum on independence. On September 18th 2014, less than a month away as I write this, people living in Scotland will go to the polls to answer the question: Should Scotland be an independent country?
Over the last couple of years there's been a good amount of media coverage and — more interestingly, from my point of view — repeat polls to gauge opinion by various newspapers and tv stations. This invites an obvious question: how has the mood in Scotland varied over time with respect to a yes/no vote? And can we detect any biases among those publishing polls?
The data
Anthony Wells (@anthonyjwells) of YouGov has put together a table of survey results dating back to January 2012. Without too much hassle we can build a messy data.frame from this in R via the XML package:
polls <- readHTMLTable("http://ukpollingreport.co.uk/scottish-independence-referendum", skip.rows=1)[[1]]
colnames(polls) <- c("pollster", "date", "yes", "no",
                     "non-voting", "dontknow", "yessplit")
polls
#                                   pollster     date yes no ...
# 1                     Survation/Daily Mail 07/08/14  37 50 ...
# 2                           YouGov/Sun (3) 07/08/14  35 55 ...
# 3                                 TNS-BMRB 07/08/14  32 45 ...
# 4                       Ipsos MORI/STV (1) 03/08/14  40 54 ...
# 5                 Survation/Mail on Sunday 01/08/14  40 46 ...
Polls over time
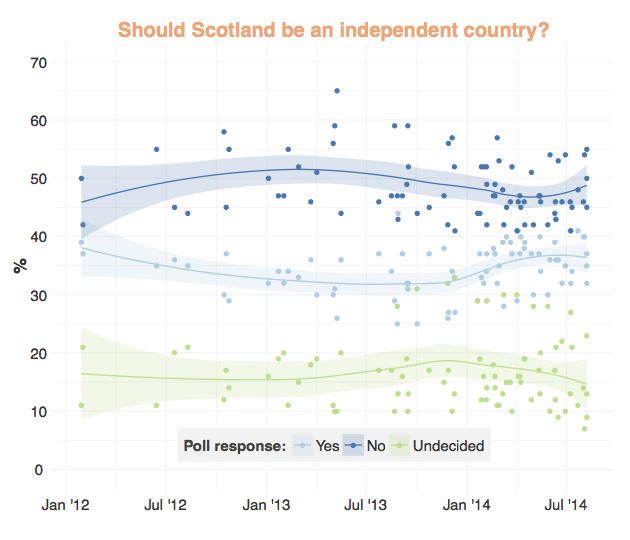
After a bit of data "janitor work", we can visualise the poll trends over time. Given sampling error and other sources of noise, a loess model can pick out the long-term trends.
Pollster biases
If we accept the above models as a reasonable estimate of the expected poll response at a given time, we can analyse the residuals of actual poll results and look for systematic biases. In theory, with a respectable sample size (all have ~1000) and a reasonably well-stratified sampling method, we might expect polls results to be roughly normally distributed around the expected polls result — regardless of who comissioned or performed the poll.
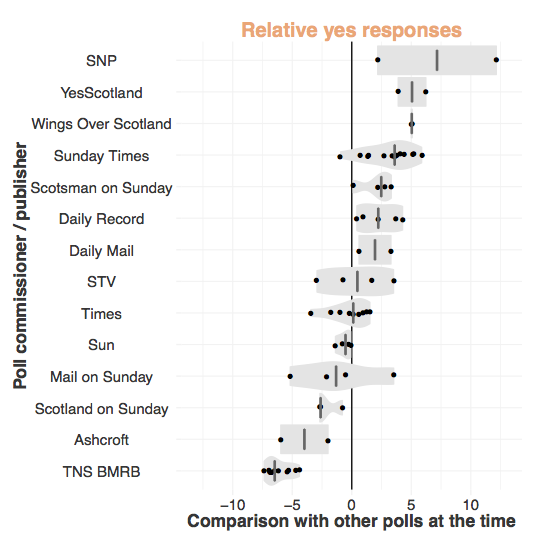
Here are the distributions per poll publisher or commisioner, note that these are only for those who commisioned more than a single poll in this dataset, and only those that my regex has been able to pick out.
The sample sizes here are generally too small to claim they are polling significantly above or below expectation, save for The Sunday Times (significantly more pro-Independence than expected, p = 7 × 10⁻⁴) and TNS BMRB, a "think tank" with offices in London and Edinburgh who seem to both perform and publish their own polls (p < 1 × 10⁻³).
# dplyr example (featuring messy subset abuse)
group_by(subset(polls, response == "Yes" &
         newspaper %in% ordering[ordering$count > 1,"newspaper"]),
         newspaper) %>%
  summarise(p=wilcox.test(residual, mu=0)$p.value)

Source: local data frame [14 x 2]

#              newspaper            p
# 1             TNS BMRB 0.0009765625
# 2             Ashcroft 0.5000000000
# 3   Scotland on Sunday 0.2500000000
# 4       Mail on Sunday 0.6250000000
# 5                  Sun 0.1250000000
# 6                Times 0.9101562500
# 7                  STV 0.8750000000
# 8           Daily Mail 0.5000000000
# 9         Daily Record 0.0625000000
# 10  Scotsman on Sunday 0.1250000000
# 11        Sunday Times 0.0007324219
# 12 Wings Over Scotland 0.5000000000
# 13         YesScotland 0.5000000000
# 14                 SNP 0.5000000000
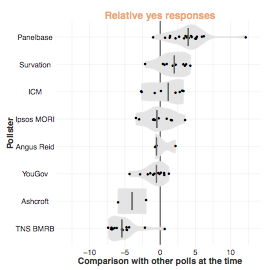
Caveats here are that different polls have used different question sets, methods etc. so this isn't evidence for anything underhanded per se. We can look at the same thing per pollster, i.e. it seems reasonable to expect that while newspapers and the SNP might have reasons to publish polls in their favour, people conducting the polls should generally be more or less indifferent.
The results again are hampered by a small number of datapoints per pollster, but the pollster Panelbase emerges as one providing significantly yes-skewed poll results (p < 6 × 10⁻⁶). Interestingly they may be the only pollster here to have a rewards system inplace. The only other significantly non-zero biased results come again from TNS BMRB, who published most of their own polls in the above graph.
Conclusion
What do the polls say? Well, the majority of Scots have been against independence for the last couple of years (and beyond), however polls appear to have been more variable in recent months and the outcome of the referendum is expected to be close.
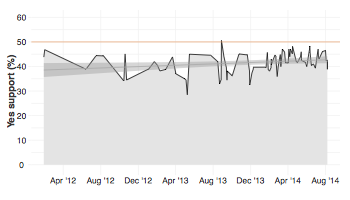
Since we have a (poorly fitting) linear model here we can — I must stress this is tongue-in-cheek — extrapolate to referendum day and get a prediction of the referendum result:
42.9% Yes
(99% confidence interval: 40.9 < x < 45.0)
R code to reproduce this analysis is available on Github.


