

#SummerDataChallenge entry by @benjaminlmoore, University of Edinburgh, UK
The starting dataset for this work was the locations and prices of house sales in and around the City of London dating from January 2009 up until May 2014, a total of almost 1.4 million datapoints. Here's an overview visualisation of all the sales in the dataset, showing their 100 km radius around the City of London. The brightness of each dot is proportional to the price of the house sale.
For summary statistics it can be helpful to aggregate house sales into postcode districts (of the form AB1) — each covered by this dataset is drawn here, coloured by median property sale price over the five year dataset. Tooltips summarise the number of listings recorded per region.
These overview visualisations introduce the starting point for this work. In the following section I'll show how detailed analysis of this dataset can lead to genuine insights which in turn generate socioeconomic value.
Consider a case study: for whatever reason, we're interested in a property located in the London postcode SW18 4HU, in Wandsworth, London — just south of the river.
For some initial analysis, we can visualise the distributions of past house sale prices within this tiny postcode area over the five years covered by the dataset, and compare this with those of the encompassing zones by: area, district and sector:
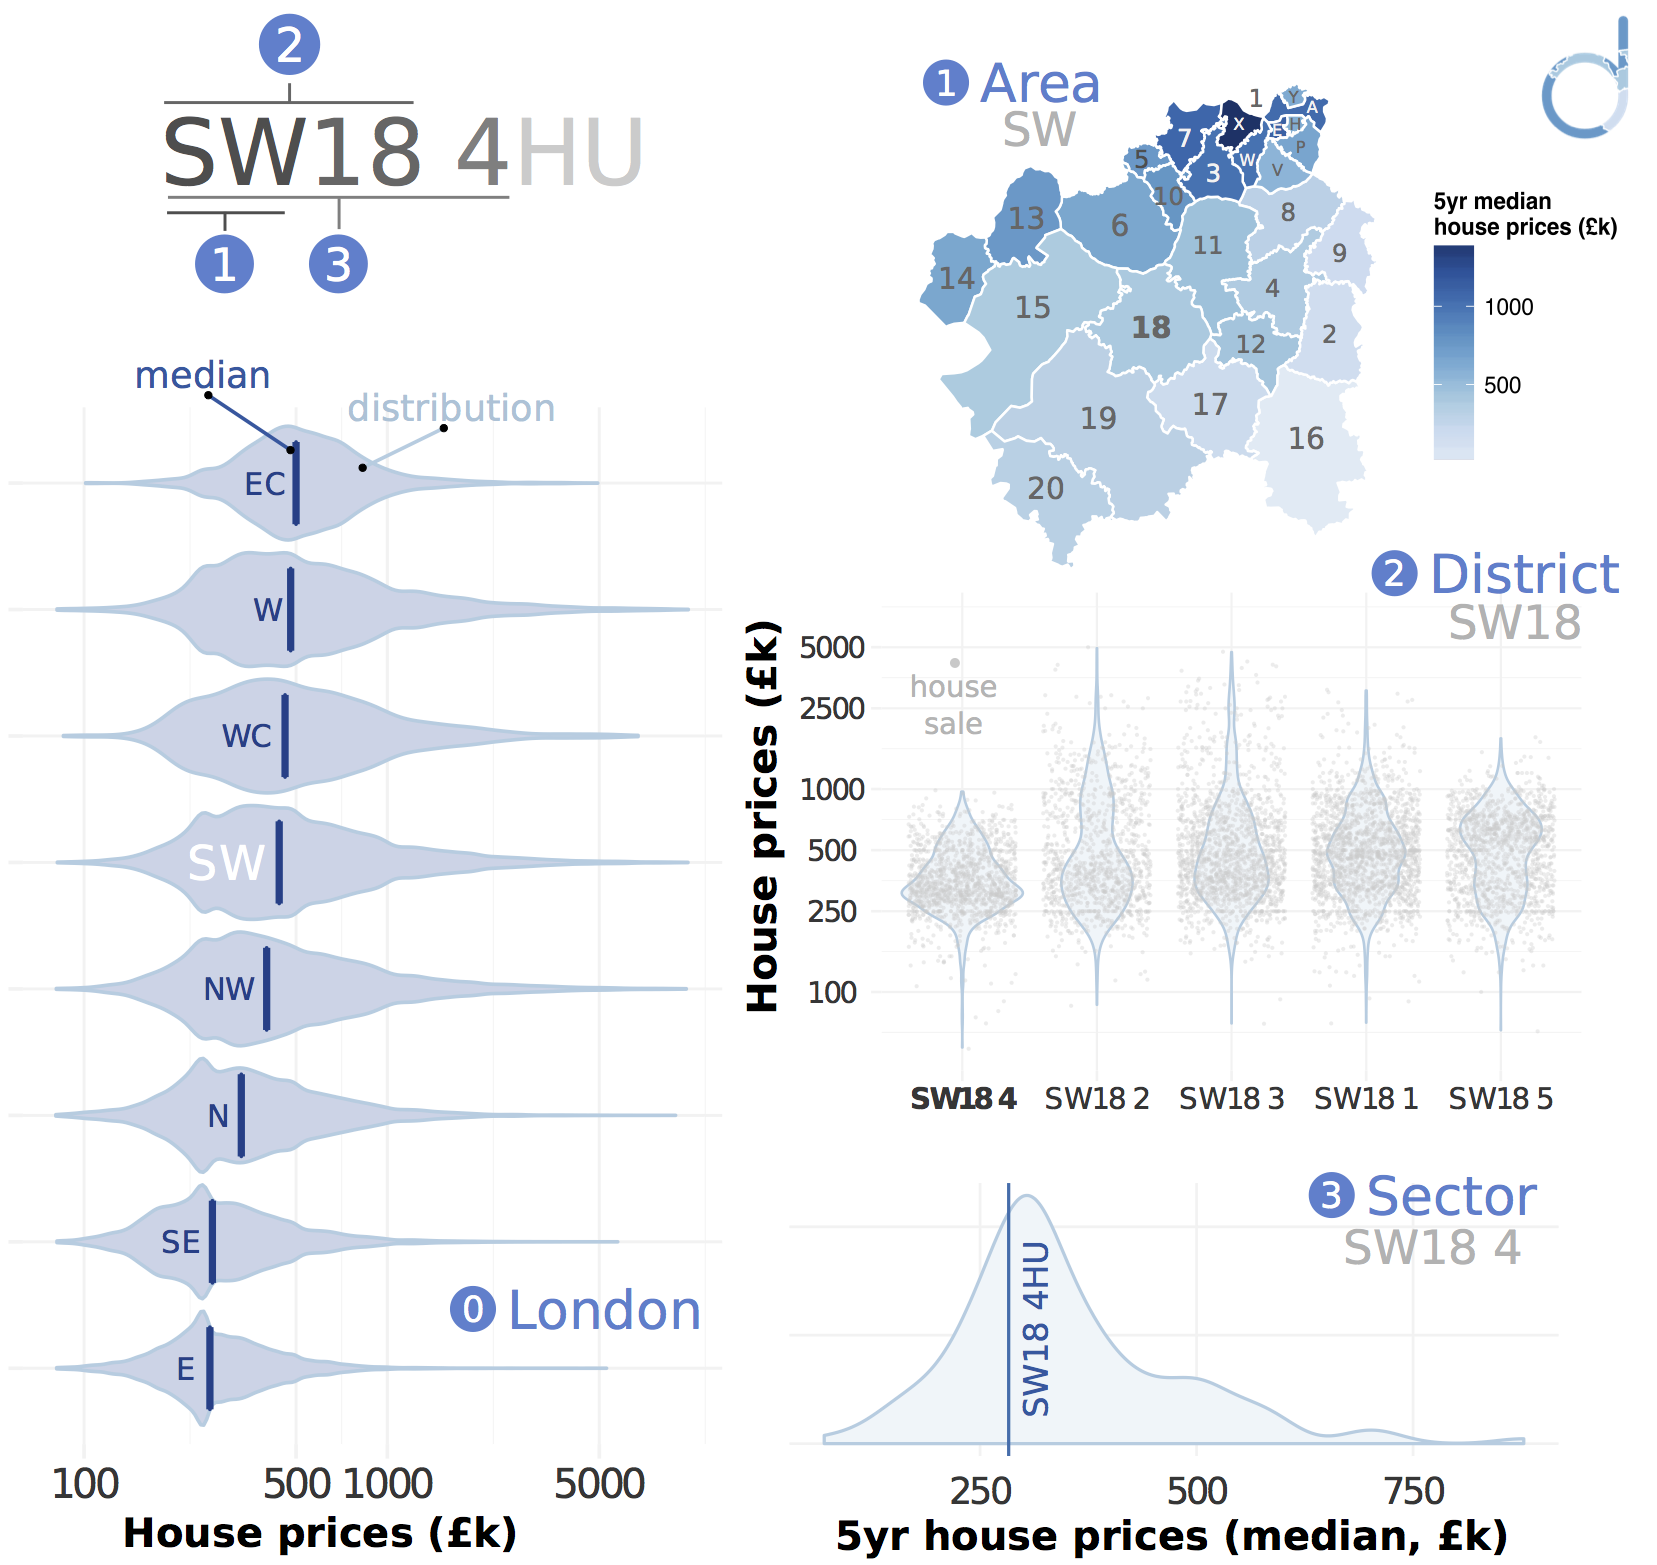
This gives the "fractal context" for house prices of a given postcode: ⓪ shows that the SW area is the 4th most expensive area in London, but ① visualises the disparity within this locale. Zooming in to SW18 for ②, we see that SW18 4 is the lowest priced district in SW18, with the narrowest range of sale prices and a noticeable absence of top-end sales. Finally at the local level, ③ identifies the full postcode area as around the median for the sector.
This combination of plots gives a data-dense description of a property location up and down the postcode hierarchy.
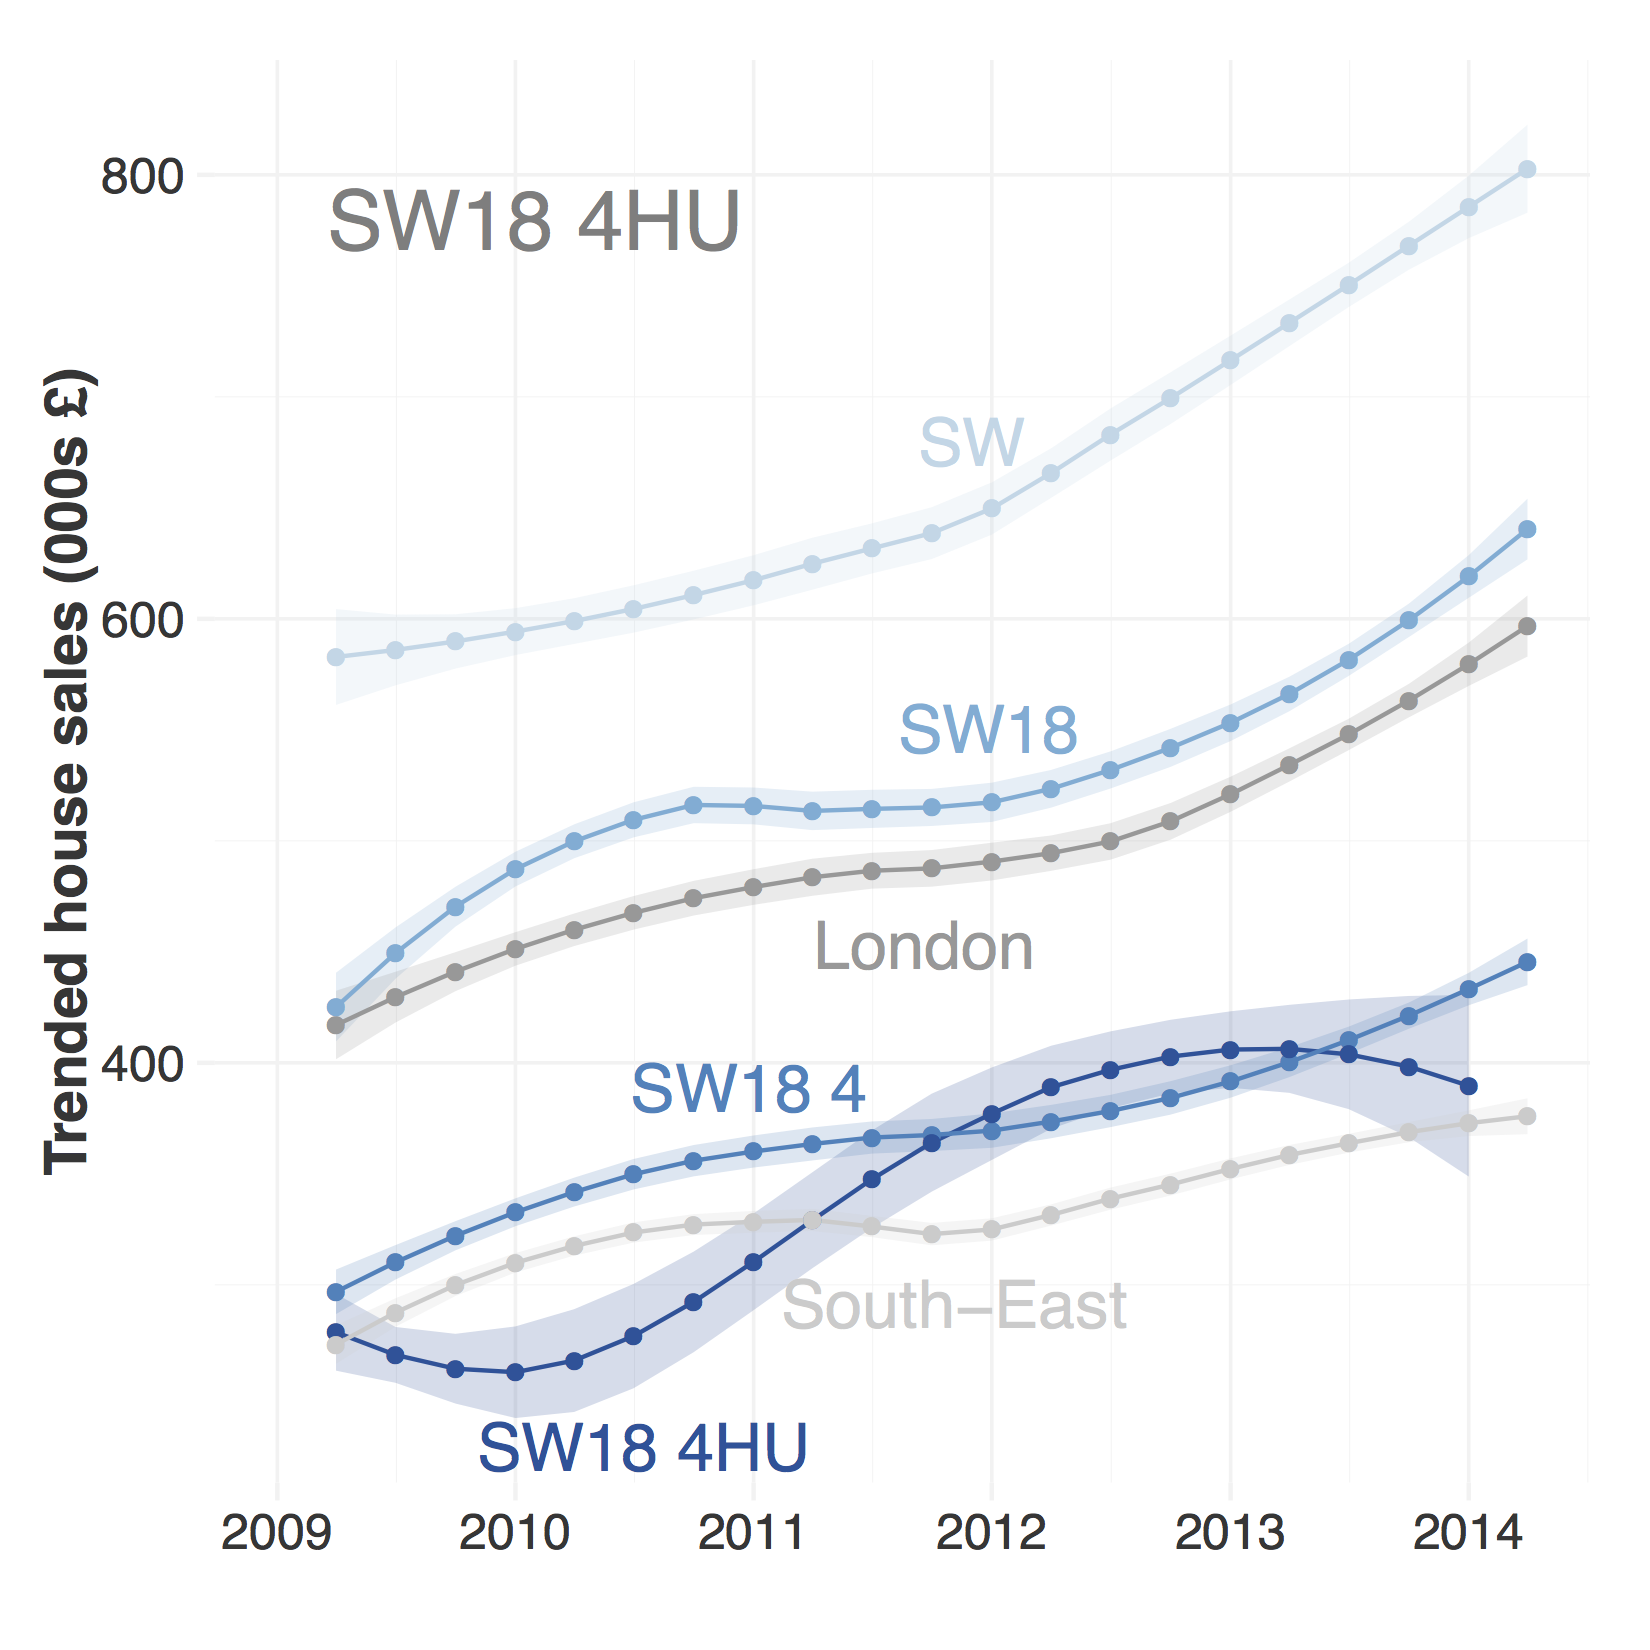
This visualisation gives an overview of an area's price history: is it recently gentrified or within an area in relative stagnation? In this instance we can see the small area SW18 4HU has been tracking below its district (SW18) and far below the SW area, but roughly in line with the SW18 4 sector, as hinted at above.
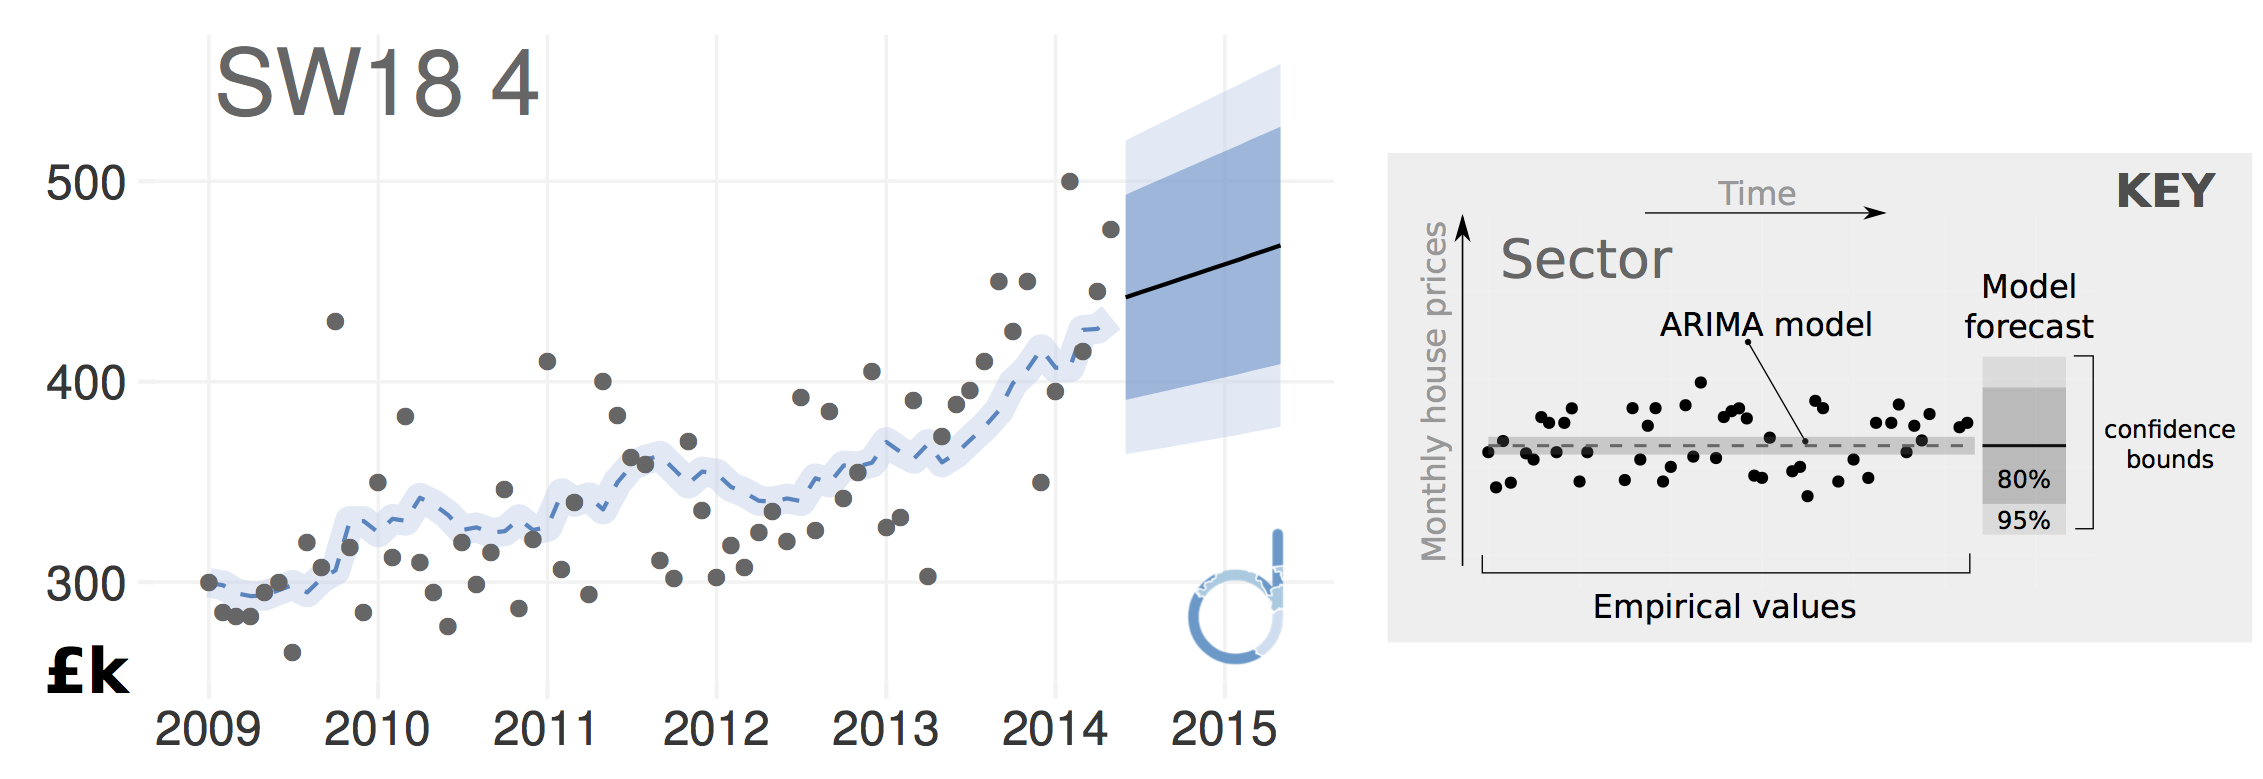
Of particular interest to the real estate speculator is forecasting future price trends. Here I'm auto-selecting the most appropriate autoregressive integrated moving average (ARIMA) model, determined by Akaike information criterion model selection, and optionally allowing for non-stationary timeseries. Each model is fit independently to a sector's monthly median house price time series — for example, here's the model and forecast for our example SW18 4 sector:
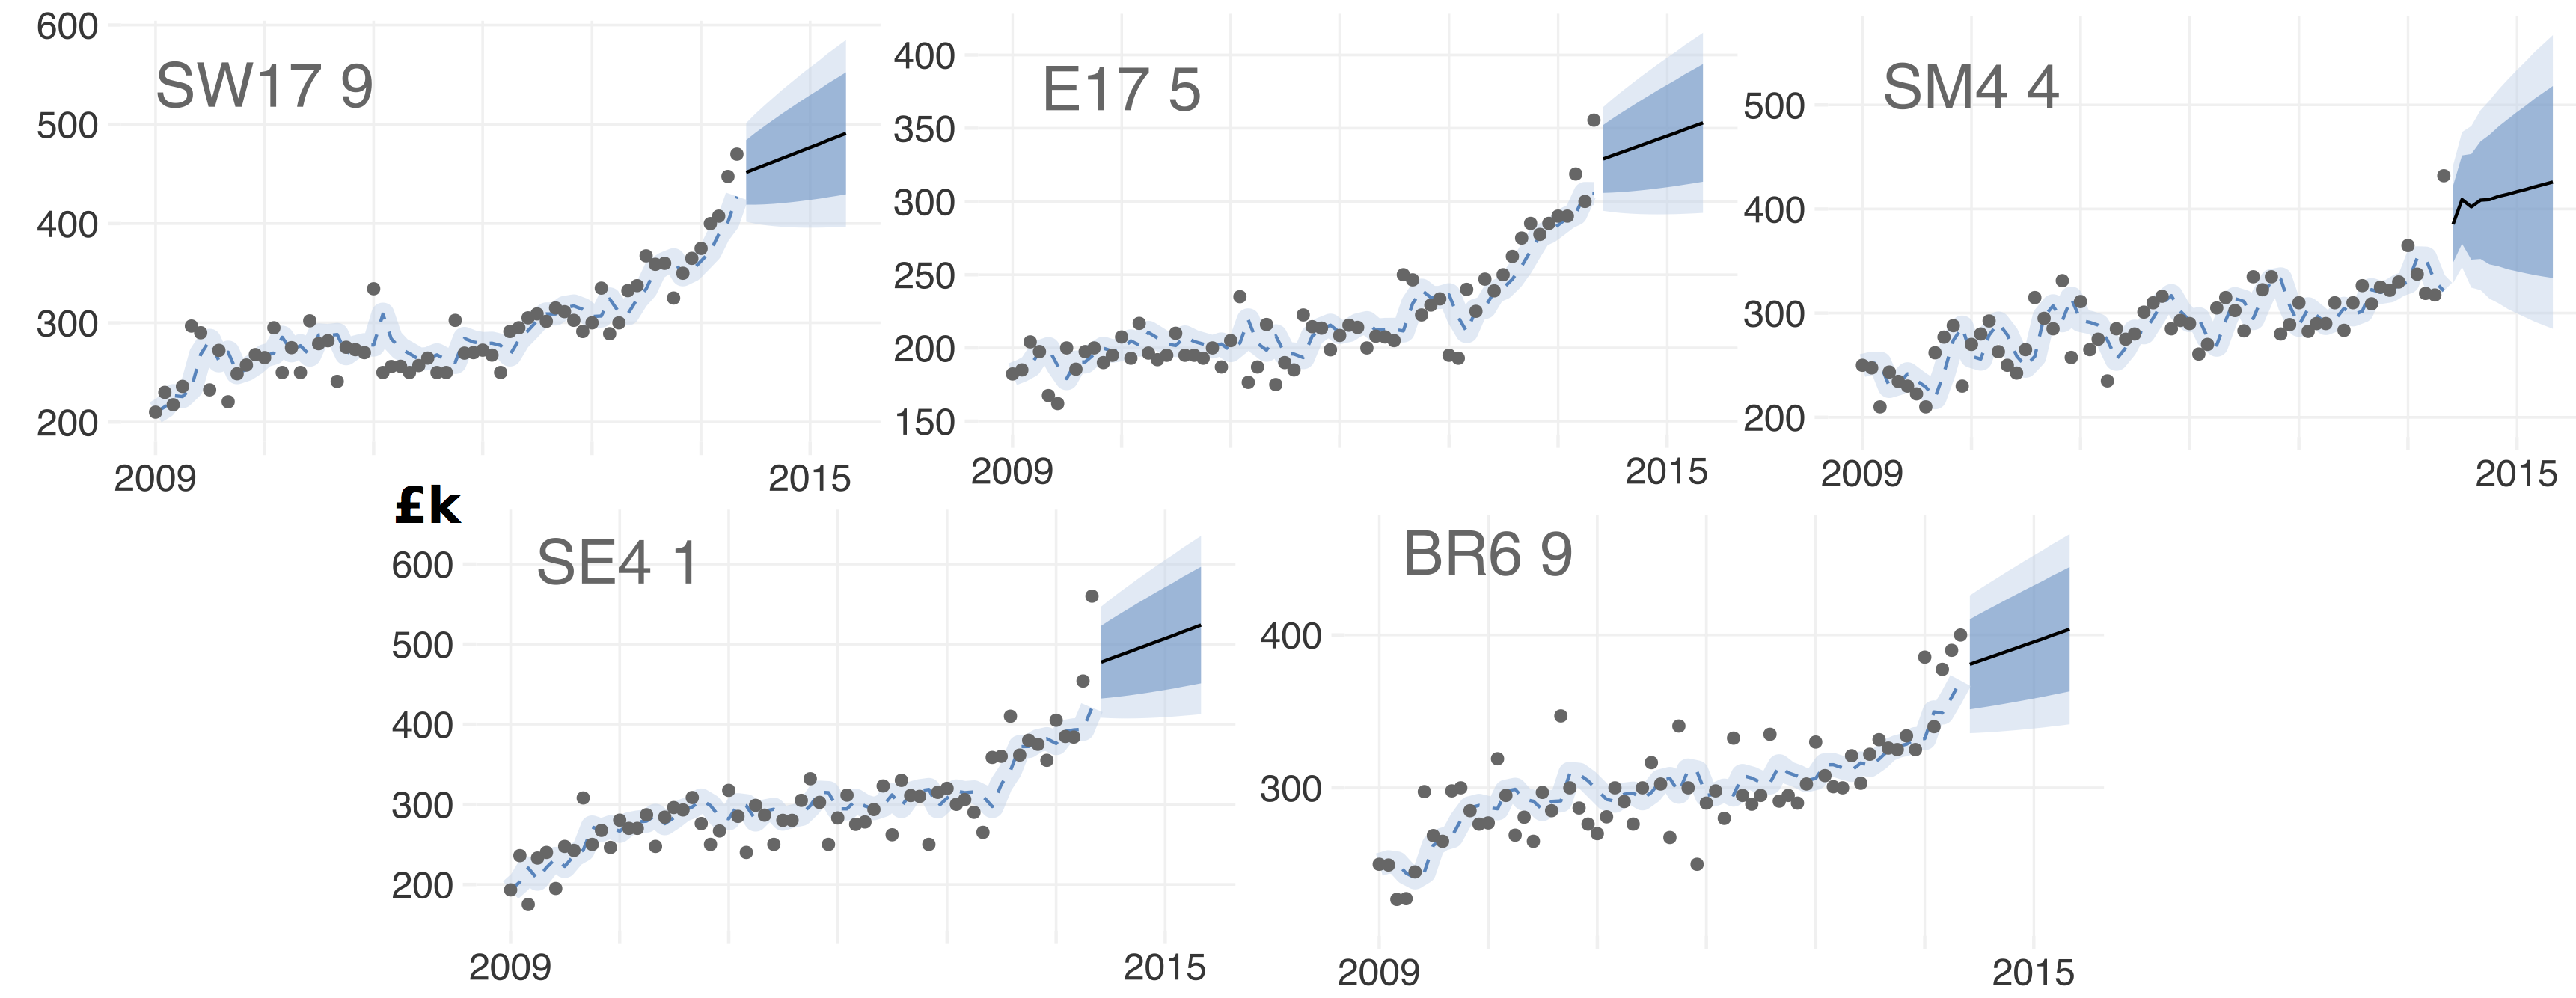
How do these projections compare to other sectors in the dataset? Here's a quick comparison with a random selection:

The forecast for SW18 4 looks gooks good relative to this handful of other sectors, but we can go further and quantify this by calculating growth forecasts for each sector in the dataset (~2600), and seeing how it ranks relative to all other regions.
Another consideration is variability, not captured in the ARIMA models drift parameter. Here we can borrow from quantitative finance, and calculate the historical volatility of house prices within a sector.
I pre-computed these two metrics for all sectors in the dataset, then used their empirical cumulative distribution functions to get a reverse quantile for each sector. That is, given a single sector's growth forecast, return its rank among all sectors, scaled from [0, 1]. Combining growth with volatility (currently equally weighted) can give a simple "investment grade" heuristic — an output metric that can easily be extended and re-weighted based on future updated data.
Here are the top 5 AAA rated postcode sectors, clearly showing their empirical low volatility and theoretical high growth forecasts:
These five include parts of the South London suburbs of Upper Tooting and Morden, Walthamstow, as well as Brockley, whose train station within SE4 1 became part of the London Overground network in 2010.
What of our SW18 4HU example? It too gets the highest "AAA" investment grade, and is in the 90th percentile for investment score relative to all postcode sectors — overall it appears to be a ripe area for property investment and you should snap up that property you were interested in.
Democratising real estate investment
datarea is a free, cross-platform app for mobiles, tablets and the web which is capable of performing deep-dive analyses of property areas, exploring temporospatial price histories and modelling future growth potential.
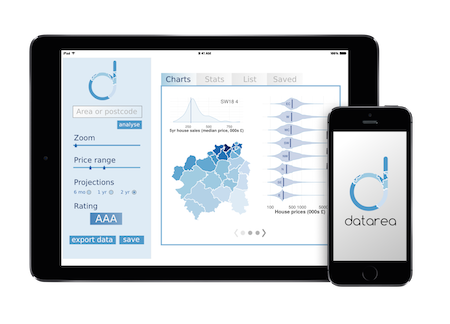
datarea generates significant value for property investors. Even the initial set of analyses — such as fractal context, price trends and investment grading — provide insight into property markets which are currently unavailable in any publicly-usable form.
It's easy to see how these interactive reports provide actionable information: where can you make the best property investment for a given outlay? Is this area enjoying exponential growth or is it riding the sigmoid to stagnation? Can you catch an undervalued sector surrounded by high-growth postcodes?
Following validation of the business through usage of our free mobile and web app, additional data scientists would be brought on board to expand our available analyses, to be offered under a subscription model. At this point we could move beyond publicly available datasets to private sales information, potentially in collaboration with online property sales and letting agents.


Having built a proven system of valuable insight, datarea could: (a) integrate our analyses with market-leading online sales and letting agents, providing significant property sales insights to the consumer market; (b) form the basis of a novel data-driven real estate investment consultancy, working with high net-worth individuals and REITs offering quantitative analysis to fuel investment decisions.
Note that the figures here have not been adjusted for inflation. The reasons for this are: a) monthly CPI/RPI estimates for 2014 are not yet available, leaving annual fall-back rates which would introduce artefacts and degrade model fitting b) the dataset comprises a small geographic area within a single country (and over just five years) so prices are comparable for the purposes of this report without adjustment.
Statistical analysis performed in the R programming language, with occasional use of the
Google maps API. Vector graphics editing
performed with
inkscape and gif to webm compression via
gfycat. One polygon map was published under a CC-BY-SA license, the
KML file is available here.
Scripts to reproduce all the analyses shown here are on github: blmoore
The contents of this document are intended to provide information to investors, but are not investment advice. Independent investment advice should be sought where appropriate.